Bitcoin Is Rallying. Learn RSI and MA With Fake Money First
Bitcoin rose about 10% in September and the urge to jump in is loud. Here is what RSI and moving averages actually tell you, what they don't, and a place to practise reading them on live prices with money that isn't real.
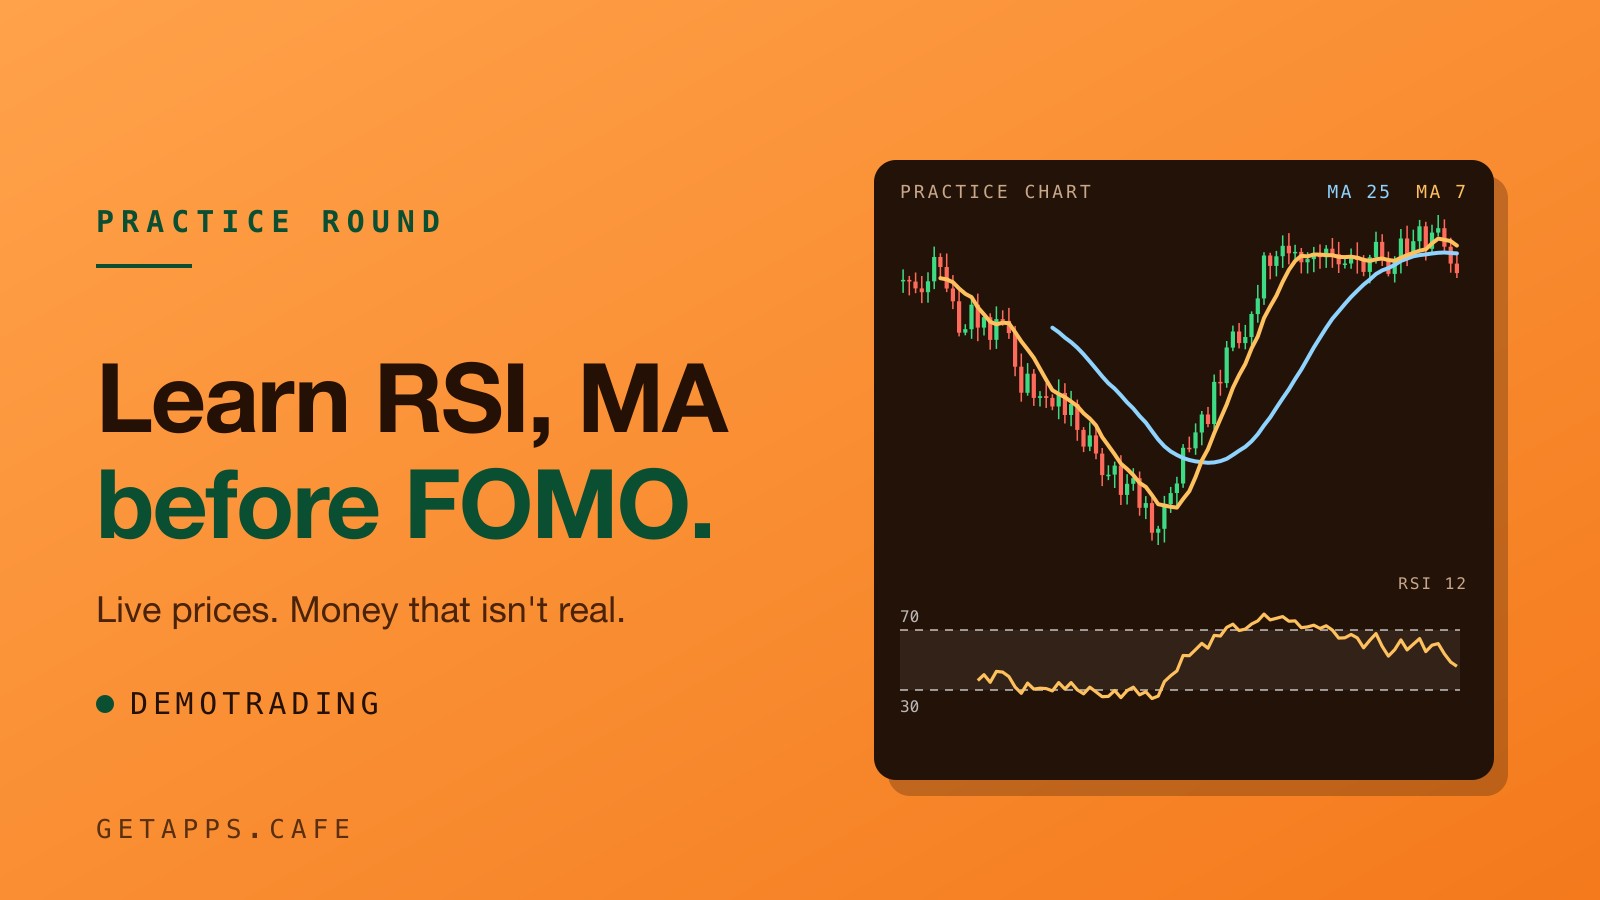
Bitcoin rose roughly 10 percent through September 2026. It briefly traded above $87,000, reaching its highest level since January. Its record, set in October 2025 above $126,000, is still well above that mark, but a climbing price makes a lot of noise.
The urge to jump in gets loud when the line keeps moving up. Before real money goes near a chart, you need a way to measure the momentum, and a place to practice reading it. DemoTrading is a desktop terminal that streams live market prices but takes trades with simulated money. It gives you a quiet room to rehearse.
Buying the green candle
A fast climb feels like a demand for action. You see a tall, solid green candle close on a daily chart, and the fear of missing the rest of the move takes over. You buy. You have no rule for why you entered, no plan for when you'll leave, and no idea how stretched the current price might be. Learning to read the market while you hold a live, unguided position is an expensive education.
You are reacting to the last thing that happened instead of waiting for a clear setup. To find a setup, you need a way to measure the trend without relying on your pulse.
Smoothing out the direction
A simple moving average is the average closing price of the last set of candles, redrawn as each candle closes, so it becomes a smooth line tracking under or over the price. A short moving average, like 7 candles, hugs the price tightly and reacts fast when the direction changes. A longer one, like 25 or 99 candles, moves slowly and reveals the broader trend.
The timeframe changes what the number means. An average of 7 on a 1-hour chart looks back over the last seven hours, while the exact same setting on a daily chart covers the last week.
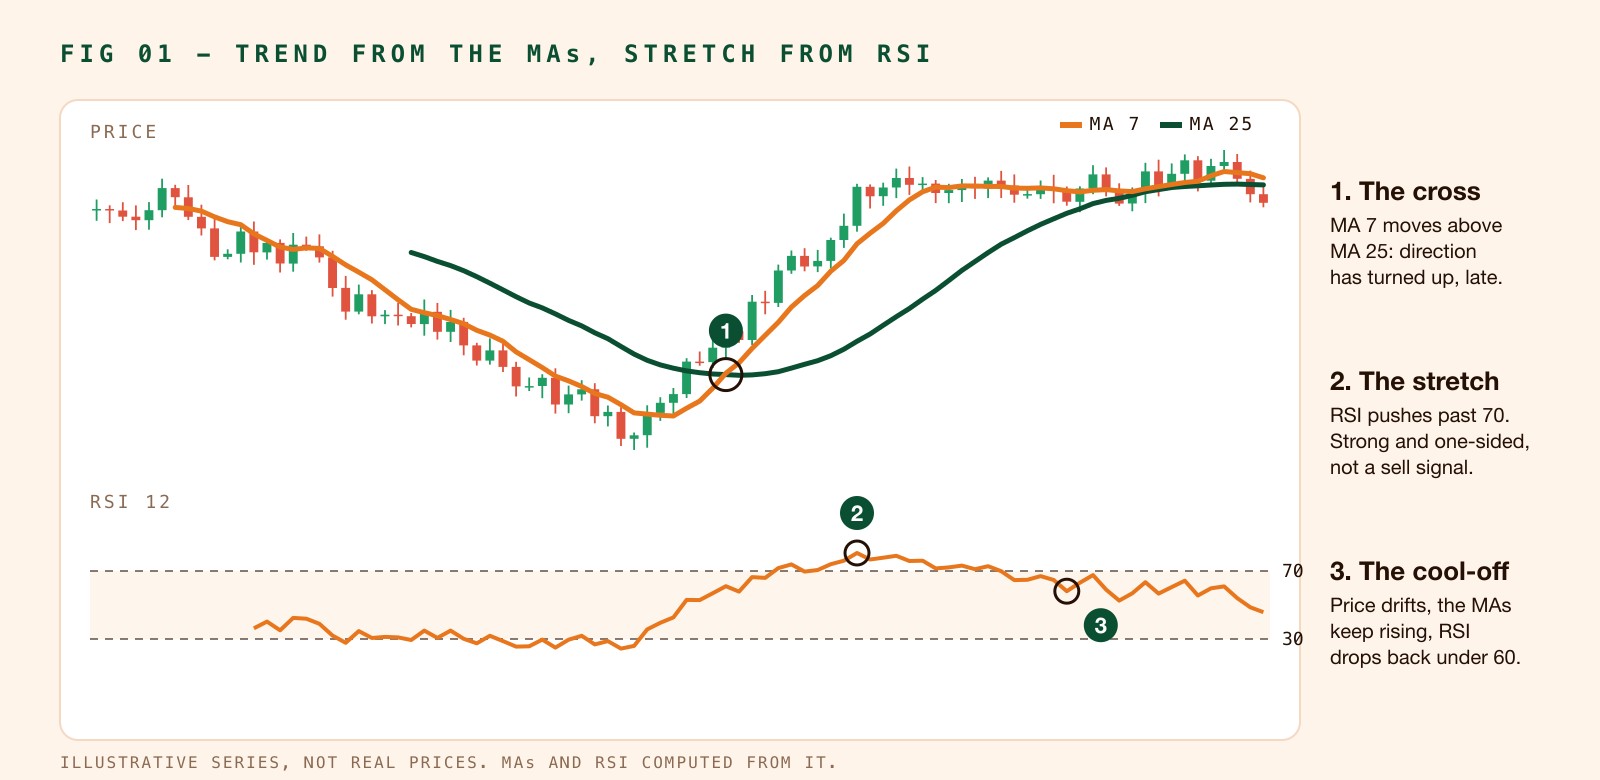
Price staying above a rising moving average is commonly read as an uptrend. If it falls below a declining one, it is a downtrend. When the short moving average crosses above the long one, traders read it as momentum turning upward. Crossing below means it is turning down. On a daily chart, a 50 crossing a 200 is famously called a golden cross or a death cross.
But they have firm limits. Because an average is built entirely from past prices, it always lags. The crossover arrives after the move has already started. In a sideways market, the lines will cross back and forth repeatedly, giving false signals called whipsaws.
Measuring the stretch
The Relative Strength Index was introduced by J. Welles Wilder in 1978. It compares the average size of recent upward moves against the average size of downward moves, scaling the result onto a rigid line from 0 to 100. By convention, a reading above 70 is called overbought, while anything below 30 is oversold. The middle is 50.
Overbought doesn't mean the price is about to fall. It just means the recent upward action has been strong and one-sided. In a powerful rally, the RSI can stay above 70 for a long stretch while the price keeps climbing higher. Selling your position the exact second it touches 70 would mean missing the bulk of the move.
A divergence is a more useful warning. If the price makes a higher high but the RSI makes a lower high, the move is losing its strength. It is a caution sign, not a precise timing signal.
Just like moving averages, the period matters. A shorter RSI period of 6 swings aggressively and touches the 70 and 30 lines often. A longer period of 24 is much smoother and touches the extremes rarely. Textbooks usually default to 14.
Matching the trend to the momentum
The moving average tells you the direction of the trend, and the RSI tells you how stretched the move is. Put them together and you get a clearer picture of the risk.
Imagine the price crosses above its long-term moving average, and the short-term line crosses up right behind it. The trend is rising. You want to buy. But you look down at the RSI pane, and the line is sitting at 86. Buying right then means buying at the peak of a sudden, one-sided surge. Instead, you wait. The price drifts sideways, the moving averages keep creeping upward, and the RSI cools off, dropping back down to 55. The trend is still intact, but the tension is gone. You buy the cooled-off dip.
Rehearsing on live feeds
DemoTrading is a crypto trading simulator that runs on your own computer. The money is not real. The prices are. The quotes, the candles, the order book depth, and the trades tape stream live from a major exchange's public market feed. You provide no exchange account and no API keys.
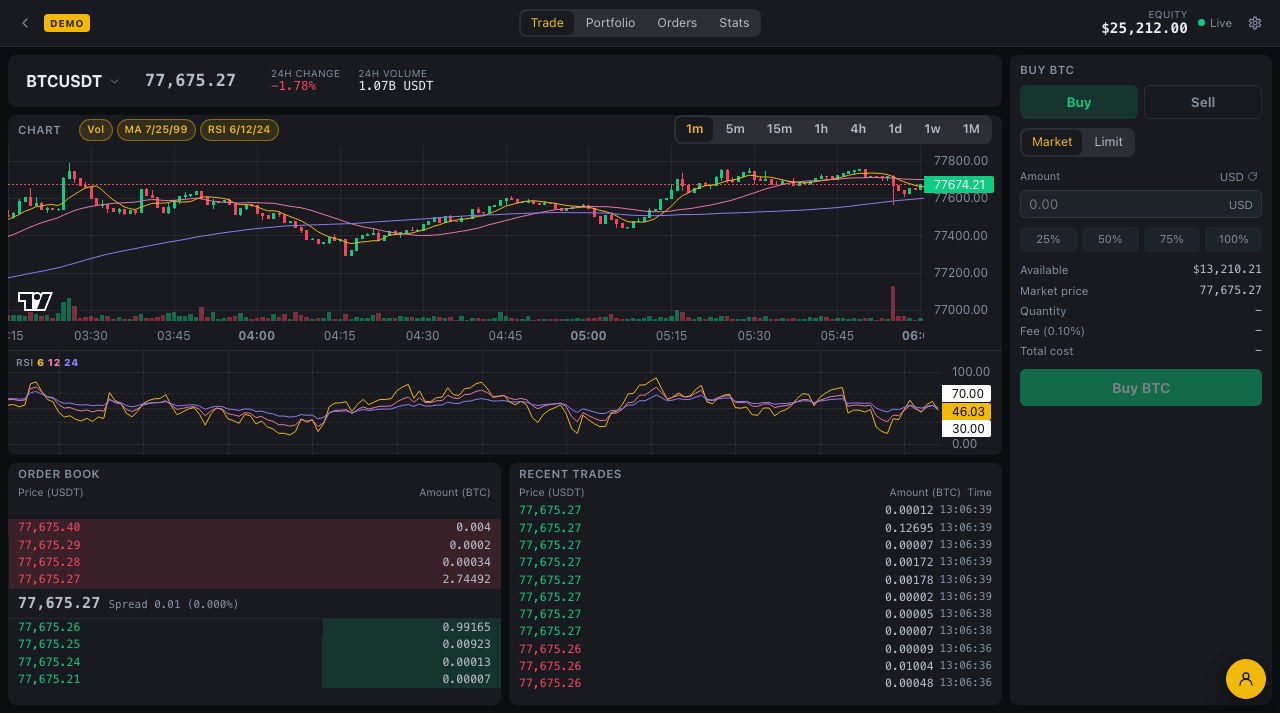
The chart has exactly three toggle chips sitting above the price: Vol, MA 7/25/99, and RSI 6/12/24. Volume is on by default. The other two start off, and once you switch one on, the app remembers it.
Toggling the MA chip draws three simple moving averages over the candles at periods of 7, 25, and 99. The RSI toggle places Wilder's index in its own pane under the price chart, drawing three lines for the 6, 12, and 24 periods with the 30 and 70 levels marked. The pane scrolls in step with the price chart above it, and the RSI value moves live while the current candle is still forming.
You can jump between eight timeframes, from a 1-minute chart up to 1 month. Every USDT pair on that exchange is searchable by name, showing its 24-hour move, from Bitcoin down to a coin listed last week.
Testing the rules
Before you touch the order ticket, write down one rigid rule. You might decide you will buy only if the MA 7 is above the MA 25, and the RSI 12 is under 70. Watch the chart until that exact setup appears.
When it does, you size your order. You can type an amount in dollars or in the coin, or click the quick 25, 50, 75, or 100 percent buttons. The ticket shows a simulated 0.10 percent fee on both sides of every trade, and the total shows before you commit. You can place a market order to enter instantly, or a limit order that rests until the price reaches it, holding your reserved balance while it waits.
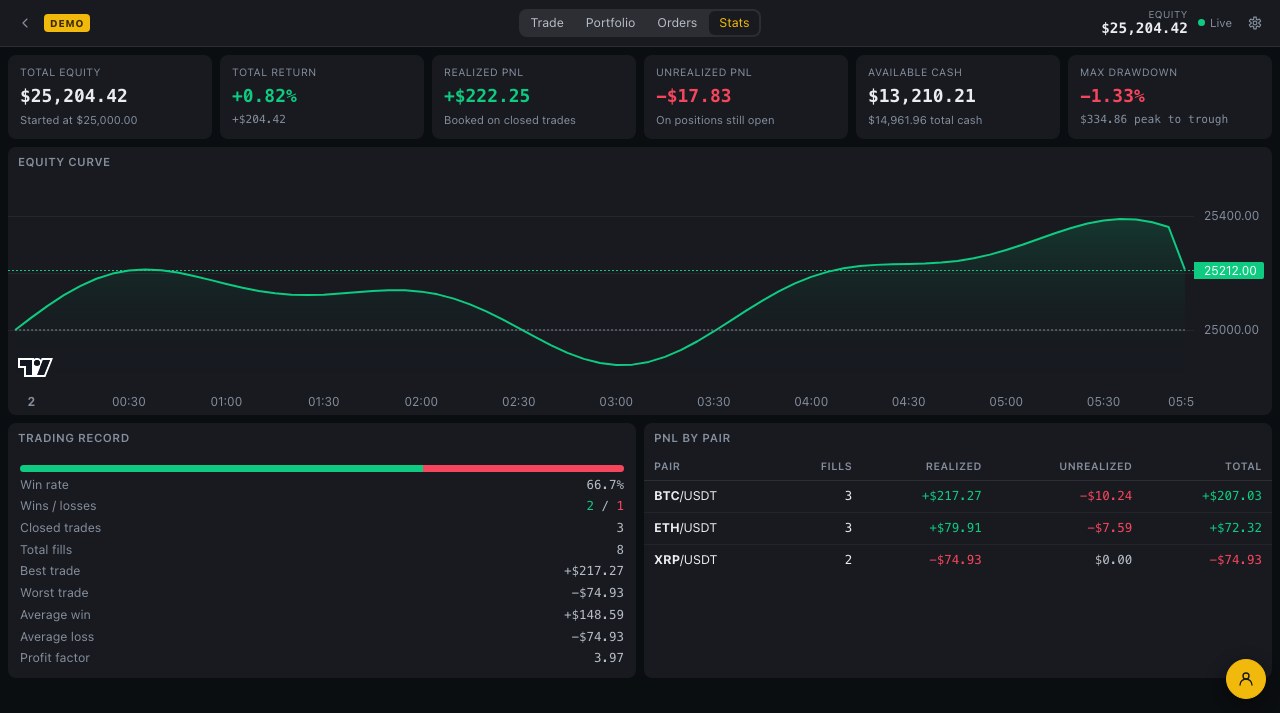
After a week of placing trades based strictly on your rule, check the Stats tab. It shows your equity curve, your total return, your win rate, and your best and worst trade. It measures your average win against your average loss, tracks your largest drawdown, and breaks down your profit and loss per pair.
You can reset whenever you like with any starting balance. Each account is a .trade file you save wherever you like, and you can open several at once in their own windows, dedicating one to each rule you are testing.
Where the simulation ends
The simulation has firm boundaries. It does not draw an RSI 14 line. The periods are fixed strictly to 6, 12, and 24, just as the moving averages are locked at 7, 25, and 99. There is no EMA, no MACD, no Bollinger Bands, and no other indicators beyond those three chips. It sits on the Frappe shelf, and it does buying and selling only. There is no leverage, and no shorting. The worst a trade can do is lose what you put into it.
More importantly, fake money fills don't feel like real money. There is no actual fear in a simulated loss, so this practice builds your reading skill, not your nerve.
Nothing here is a recommendation to buy or sell Bitcoin or anything else, and an indicator signal that worked in the past guarantees nothing about the next one. But before you test your nerves with a live balance, you can test your eyes with a fake one. Try the free trial to put DemoTrading on your machine and watch the tape.